Enterprise-wide threat hunting may seem like a daunting task - and for non-seasoned forensic noobs it definitely can be. However, there are various techniques that can provide the most bang for your buck when deciding to embark upon a threat hunting engagement to seek out evil. For this particular article we’ll focus on leveraging the Windows Application Compatibility Cache, a.k.a. Shimcache, and discuss the benefits in doing so given the wealth of information that can be stored within such a small cabinet of the Windows OS.
To begin, lets define what the Shimcache actually is. Microsoft introduced the Shimcache with the release of Windows 95 and still to this day remains the mechanism for ensuring backward compatibility with older binaries. This was an effort to prevent legacy applications from breaking as new versions of the operating system were released. This cache will store a record on binaries that have executed on the system in addition to tracking executables that have not executed but may have been browsed too through explorer.exe. There are of course some limitations here. On Windows XP it can only maintain up to 96 entries; on Windows 7 and up it can maintain up to 1,024 entries. If you still happening to be doing forensics on Windows XP devices, God bless you and the organization that still runs that OS.
In order to view the contents of the Shimcache, you’ll need to either forensically collect the SYSTEM file located in c:\windows\system32\config OR via an administrative command prompt run the query below to export the registry file.
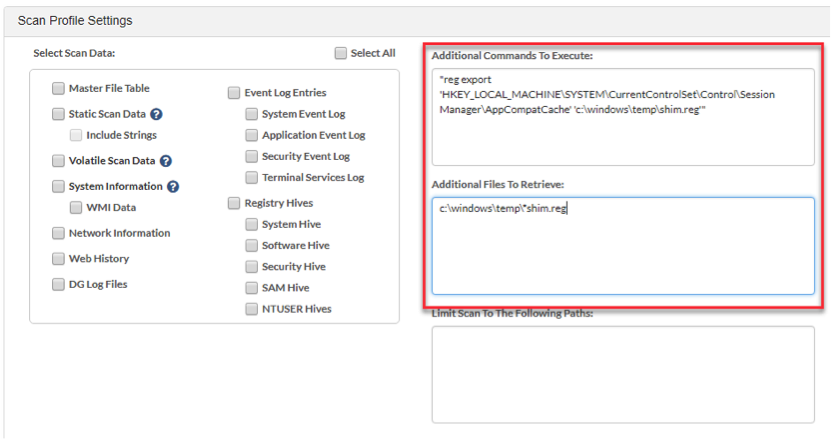
reg export “HKEY_LOCAL_MACHINE\SYSTEM\CurrentControlSet\Control\Session Manager\AppCompatCache” c:\windows\temp\shim.reg
Note: The output location of the file will be in the Windows Temp directory.
Once we have this data, we now use a parser that has been written by some uber nerd to extract the contents. I typically rely on Mandiant’s freeware tool over on Github to do this deed since they have a bunch of smart people over there.
When we run the parser, we see information relating to Last Modified Time, Last Update, File’s Full Path, File Size, & Execution Flag.

As we traverse the list of entries it’s important to look out for suspicious programs that have ran, odd directory locations, misspelled binaries, etc. This may provide a clue into a possible compromise of the machine and allow us to pivot around that timeframe for any additional indicators. Often times this may require a deeper forensic dive on the device such as inspecting $MFT, event logs, and registry data; however for now the intention of Shimcache analysis is to seek out that thread to pull on.
This method of course is great when looking at a single machine; but let's think bigger here. How do we take this concept and apply it enterprise-wide for an exciting hunting expedition?
In order to do this of course, we’ll need to first collect all Shimcache registry keys across the environment. If you’re running Digital Guardian with EDR, simply enter the export command within the Additional Commands to Execute box and configure the Additional Files to Retrieve section with the output file path. There are of course a variety of methods for pulling this data depending on the technology you have deployed or even just writing a custom script to do so, but trust me; totally worth it!
Once this data is pulled back, we leverage the Mandiant script to churn through all of that output and store it in CSV format. Now we have a repository of historical process execution across the entire enterprise. But we’re not done yet!
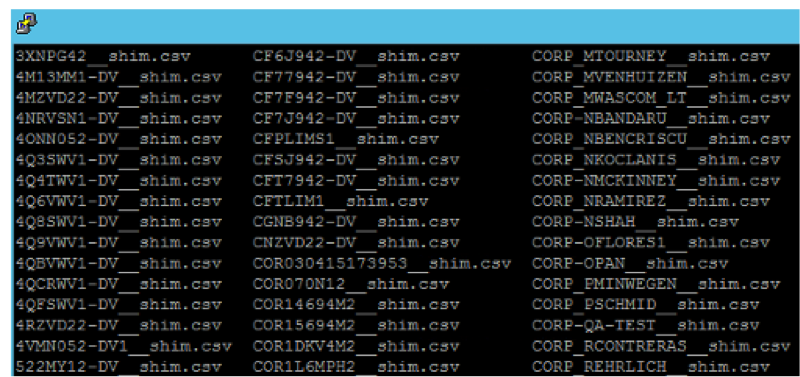
In order to analyze this information, there are a couple of options. We could pull out our Grep-Fu ninja skills and write some overly complicated regex queries sprinkled with some awk & sed; or I could install a Splunk forwarder on this box and ingest into an analytics tool which would make my life a heck of lot easier! If you don’t have Splunk, you could always leverage an ELK stack (Elastic/Logstash/Kibana) or possibly get away with just using the free license for Splunk since the data is relatively small in size. Either way, this is definitely the easiest method for correlating all that data.
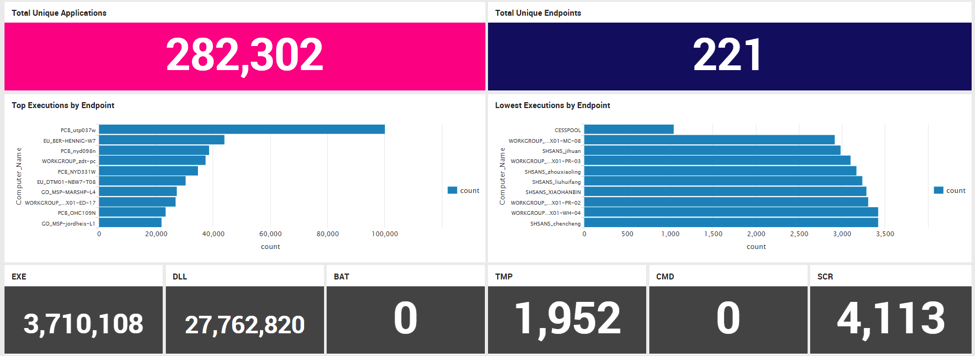
Next, we want to build out a Dashboard to visualize this information into various sections with queries that focus on suspicious activity in general. The top of our chart will contain some cool eye-popping jumbo numbered stats on Total Unique Applications, Total Endpoints, along with stats on Extensions observed.
|
Blog Post What is Threat Hunting? The Emerging Focus in Threat Detection |
Next we want to focus on querying suspicious activity across our Shimcache artifacts. Below are a set of some of the tables that can be used for doing this analysis.
Single character binaries
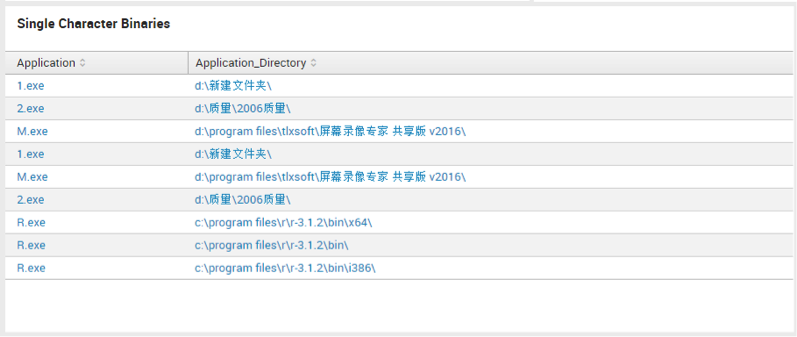
regex Application="^\w{1}\.exe$"
Two Character Binaries
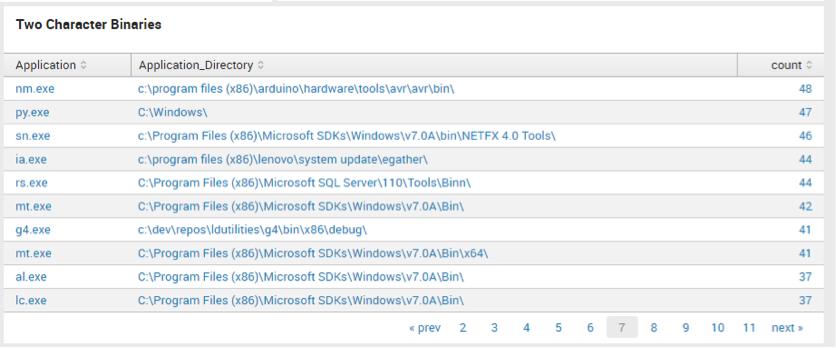
regex Application="^\w{2}\.exe"
Execution from Temp

regex Application_Directory="(\\\\windows\\\\temp|C:\\\\temp|\\\\appdata\\\\local\\\\temp)"
(And yes I’m aware there are a lot more temporary directories but feel free to bring on a gargantuan amount of false positives to sift through.)
Execution from Secondary Drive

regex Application_Directory="(D:\\\\|F:\\\\|E:\\\\|G:\\\\|H:\\\\)"
Misspelled Binaries

regex Application="(crss|lsas\.exe|serv1ces|expl0rer|scvhost|svch0st|svchosts|svchots|suchost|rundll\.exe|rund11\.exe|rund1132\.exe|rundll64)"
Password Dumpers

regex Application="(cachedump|credump|fgdump|g32\\-|g64\\-|gcx64|gcx32|gse\.exe|pwdump|pwhash|getlsasrvaddr|gsecdump|hash32\.exe|hash64\.exe|iam.exe|iam-alt|lsasecretsdump|lsasecretsview|lsaview|lslsass|lz77|mimi_morph|mimikatz|mimilove|netpass|passwordfox|pcanypass|pstpassword|routerpassview|samdump|wca.dll|wce.exe|wceaux|whosethere|wirelesskeydump|quark|ophtcrack|acehash|ace64\.exe|
Suspicious Binaries

regex Application="(rexec|xcmd|servpw64|psexe|lcx|^nc\.exe|nmap\.exe|nping.\exe|ncat\.exe|winrm\.cmd|winrs\.cmd|nbtscan\.exe|wmiexec|smbscan|osql\.exe|^[0-9]{1,5}\.exe)"
Suspicious Folder Execution

regex Application_Directory="(RECYCLER|Recycle|Cookies|tsclient|Users\\\\NetworkService|\\\\AppData\\\\Roaming\\\\Identities\\\\|\\\\Start Menu\\\\|\\\\windows\\\\security)"
PsExec Usage
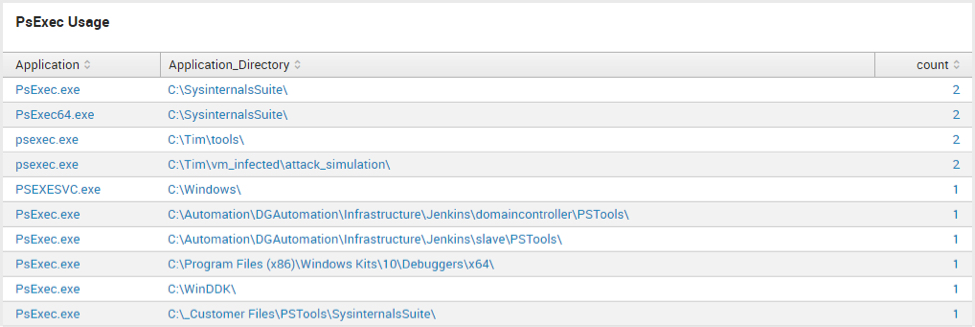
search Application="*psexe*"
This is really just a handful of queries that can be leveraged for your threat hunting dashboard. Ultimately applying contextual knowledge about your own environment and removing any noise will be your end goal here as you build in additional searches across the enterprise. One of my personal favorites is the PsExec usage query because it can often times uncover suspicious directories that the lateral movement tool is being ran from. Investigating these types of findings can possibly lead to some very interesting results for seeking out potential intrusions.
If this is something you have yet to engage in as part of your threat hunting program, I highly recommend it. One lesson I learned very early on in my career is to “never let an incident go to waste.” Although it's always unfortunate when a successful intrusion takes place, it’s also an opportunity to hopefully gain some additional funds and/or resources to assist in fighting the good fight!
Happy Hunting!
